Footfall-induced office vibration problem
Excessive vibrations caused by footfall on a new 16m span open-plan office floor were successfully r ...
Read
MoreAn existing 380m² suspended office floor was rapidly converted into a gym within a multi-storey building in the centre of London. Despite adequate static structural strength, dynamic loading from the gym risked transmitting excessive vibration to other areas of the building.
Architectural, structural and logistical constraints meant CALMFLOOR was the only feasible option that would control floor vibrations effectively.
Please click below to view or download the formatted PDF version of this case study.


The floor structure was expected to have a low natural frequency, below 10 Hz. As a result, typical rhythmic gym activities such as aerobics, jumping or treadmill running were likely to cause significant resonant response. These dynamic forces can be up to an order of magnitude higher than vibrations induced by a single person walking, for which office floors are normally designed.
The key challenge, therefore, was controlling vibrations likely to be excessive due to both resonant excitation and relatively large dynamic forces. A further challenge was the presence of open-plan offices immediately below the gym floor.
Architectural and functional constraints prevented the usual vibration mitigation approach for gym floors: using shorter spans to stiffen the floor and increase its natural frequency so that it cannot be excited in resonance by gym activities. In addition, vibrations from the gym floor could be transmitted through vertical load-bearing elements (typically columns and walls, and sometimes the façade) to the open-plan office floors above and below, which have more stringent vibration requirements.
This issue of vibration transmission within a multi-storey building with mixed uses and differing vibration criteria is well known. This issue was recognised early in this project’s development and had to be addressed within very limited timescales.
Transmitted floor vibrations can be reduced either at the source (by reducing gym floor vibration) or at the receiver elsewhere in the building. The advantage of source control is reduced vibration spread, but the challenge is dealing directly with relatively large local floor vibrations. This, together with other practical considerations, led to the decision to control the gym floor vibrations directly.
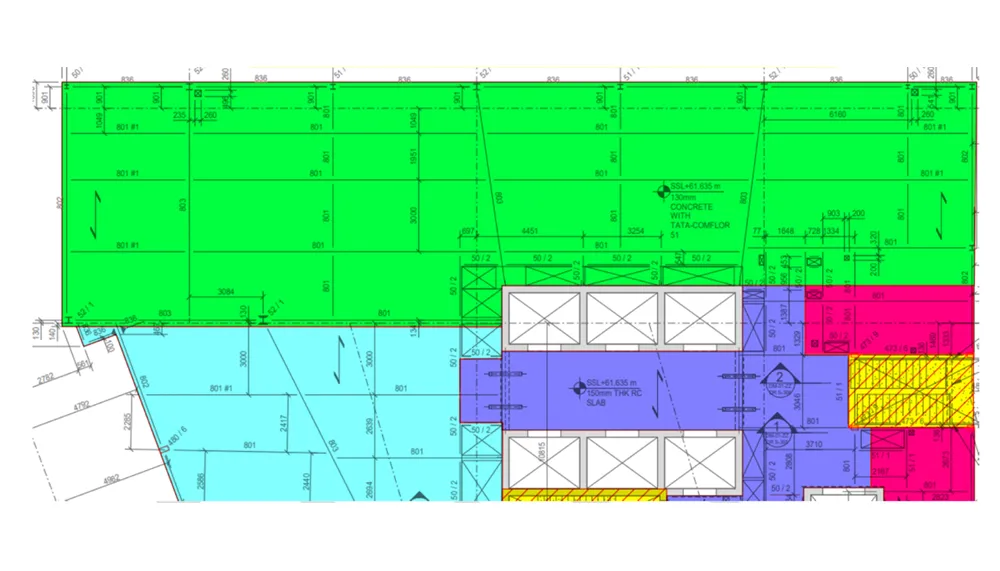
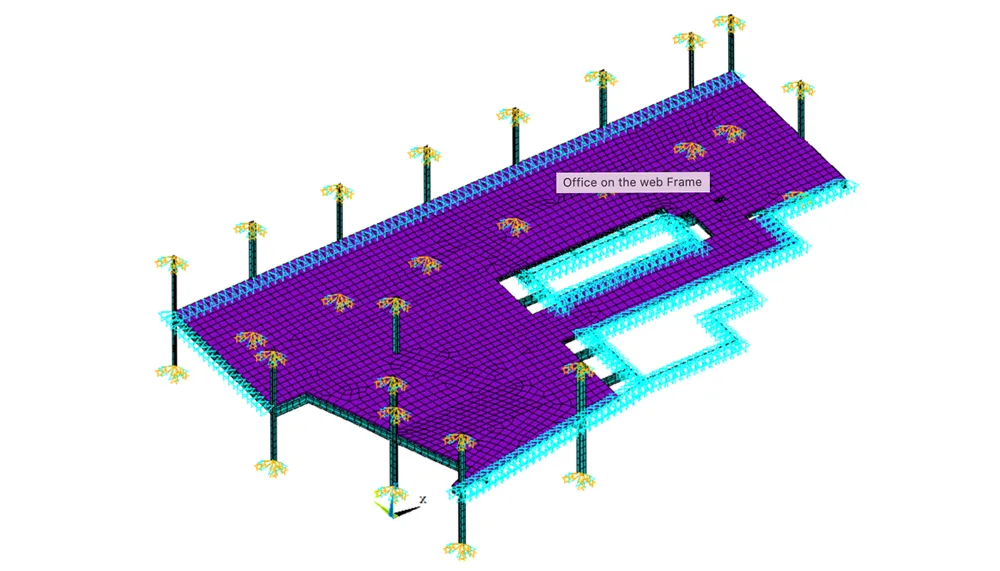
The first step was to establish the magnitude of the problem. Although the approximate geometry of the floor plate boundary was rectangular, it was a complex structure featuring somewhat unevenly distributed columns, walls and primary and secondary beams. It also had complex boundary conditions along long edges that connected to the rest of the building at that level (Image 1, right). To simulate its vibration performance, a finite element (FE) model of the floor was developed using available structural information and best engineering judgement (Image 2, right).
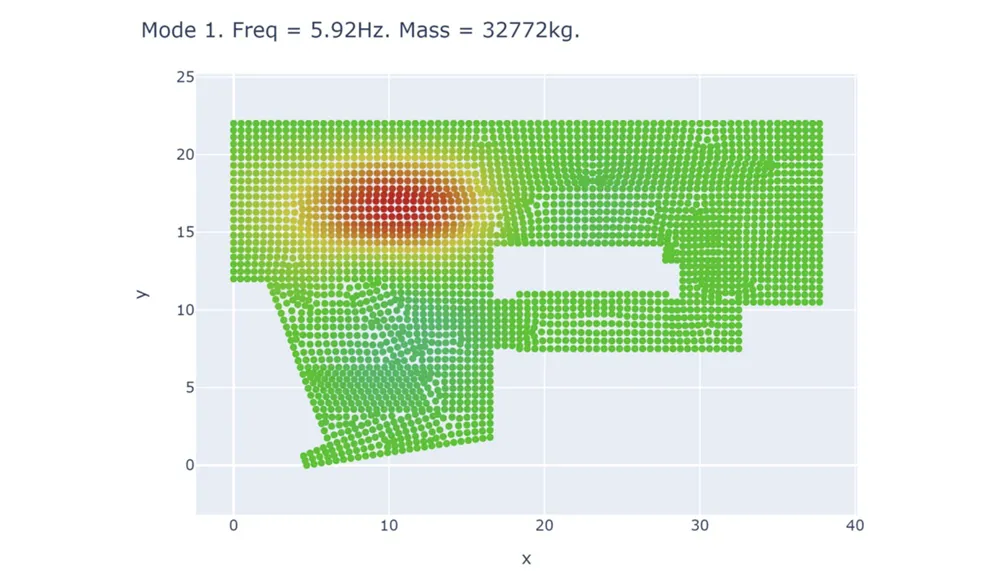
Figure 3 below shows the plan view of the fundamental vertical mode of vibration at 5.92 Hz, indicating this was indeed a low-frequency floor excitable in resonance. The unity-scaled modal mass was just under 33 tonnes.
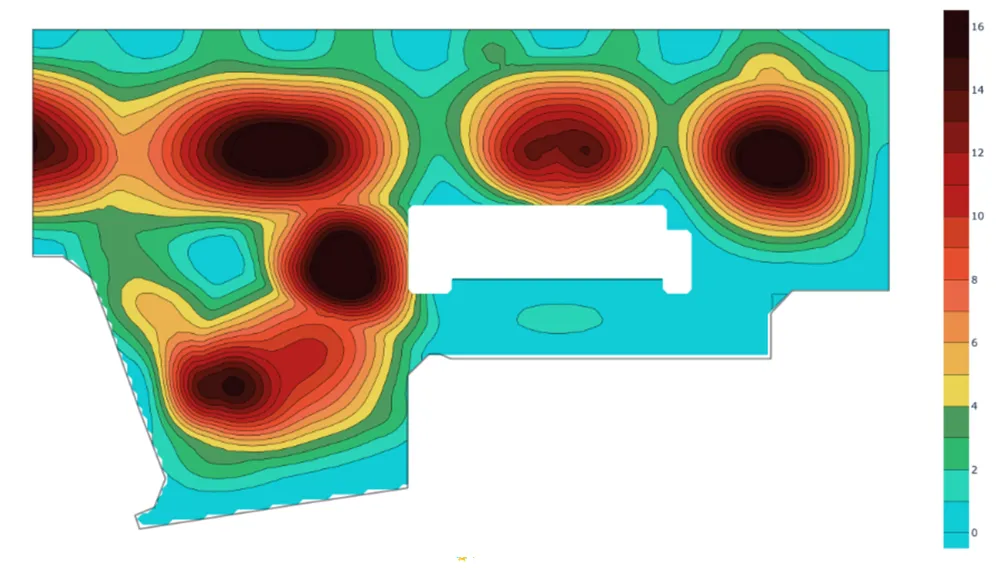
17 modes of vibration were found below 20 Hz engaging various parts of the floor plate. Following the Steel Construction Institute (SCI) design guide P354, the calculated modal properties were used to predict responses due to aerobics. The calculated response factors at each FE node are shown in Image 3, right.
The absolute maximum response factor (RF) calculated was 19.5 with significant floor area with RF>16, shown as black ‘hotspots’ in Image 4, right.
The calculated levels of the gym floor vibration were roughly two to four times greater than what would be acceptable for a normal office environment, depending on design guideline used. As such, there was a real risk for vibration transmission to other floor levels that included offices. Hence, there was a need to control and reduce the gym floor vibrations as a source of structural vibrations throughout the building.
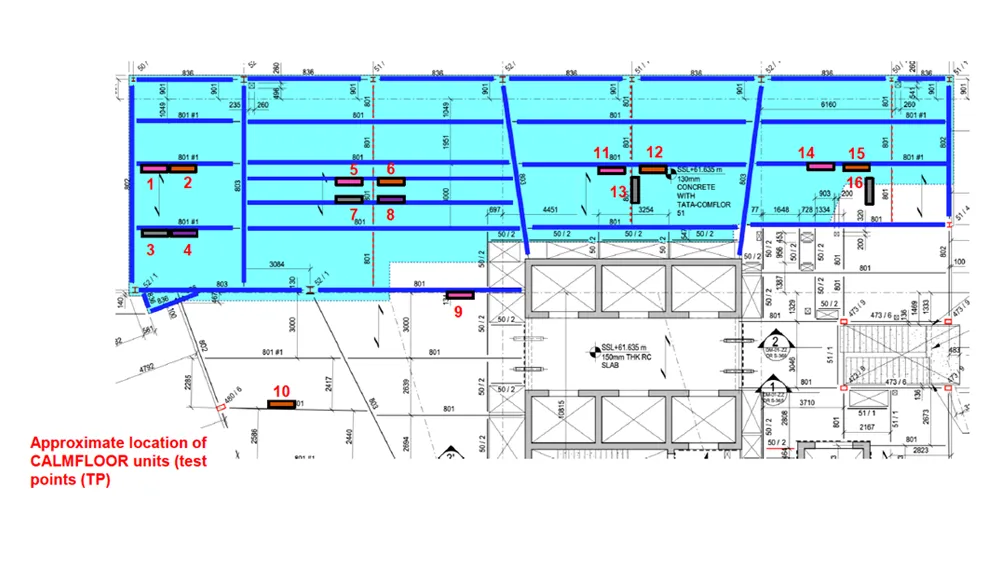
To control such a high level of gym floor vibration, 16 CALMFLOOR units were clustered around the vibration hotspot areas, as shown in this background image.
The clustering was needed to counter relatively large, gym-induced dynamic forces with between two and four CALMFLOOR units joining their vibration control forces by being close to each other.
The ultimate aim was to halve the level of gym floor vibration at the source because people, the main receivers of the transmitted vibrations from the gym floor, struggle to detect small reductions in floor vibrations. However, when vibration is reduced by about 50%, it feels very different and the floor is perceived as significantly calmer. This target is ambitious in the context of transmitted gym vibrations.
In addition, gym users on the gym floor are relatively less bothered by perceptible vibrations due to the nature of such spaces. Gym vibration predominantly affects neighbouring floors and rooms rather than the space where it is generated, particularly where these have different, typically quieter, uses such as offices. Therefore, if vertical vibration in the gym floor is halved, connected spaces, such as nearby offices, corridors and other floor levels, would benefit automatically without the need for further local vibration reduction treatment.
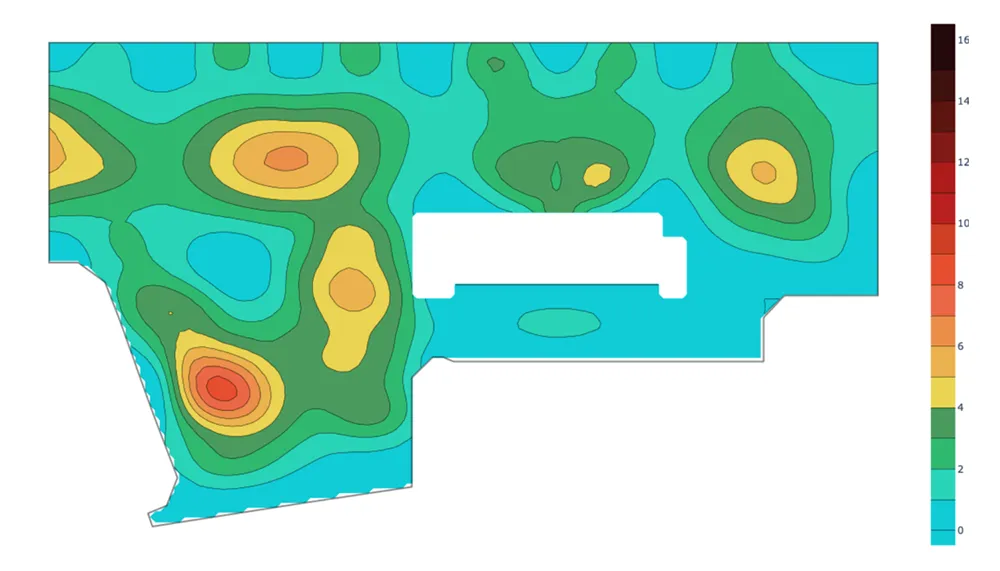
Image 5, above shows the CALMFLOOR-controlled gym floor vibration levels expressed in terms of RF for the same aerobics activity used previously for the uncontrolled RF calculation used in Image 4, above.
The absolute maximum RF is 7.8 in a limited area of the floor away from the main gym area. Therefore, the simulations demonstrated that the approximate halving of floor vibration was possible, at least on paper. Based on this indicative performance, 16 CALMFLOOR units were installed at locations shown in Image 6, above.
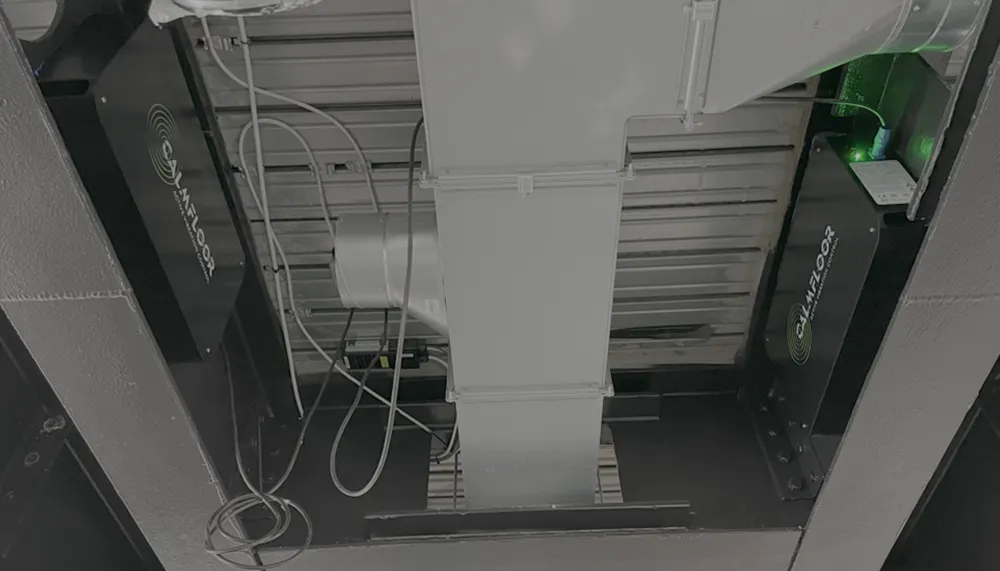
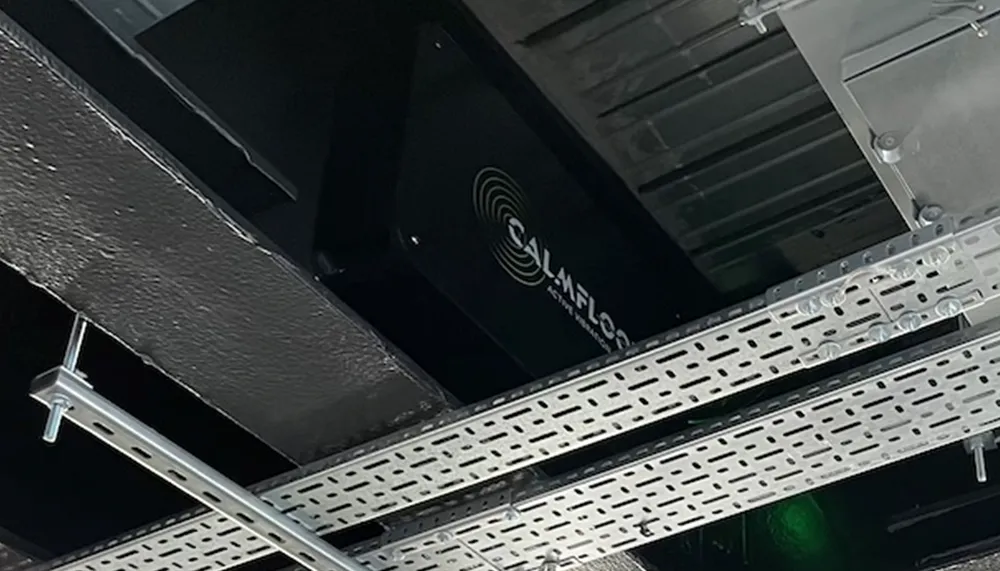
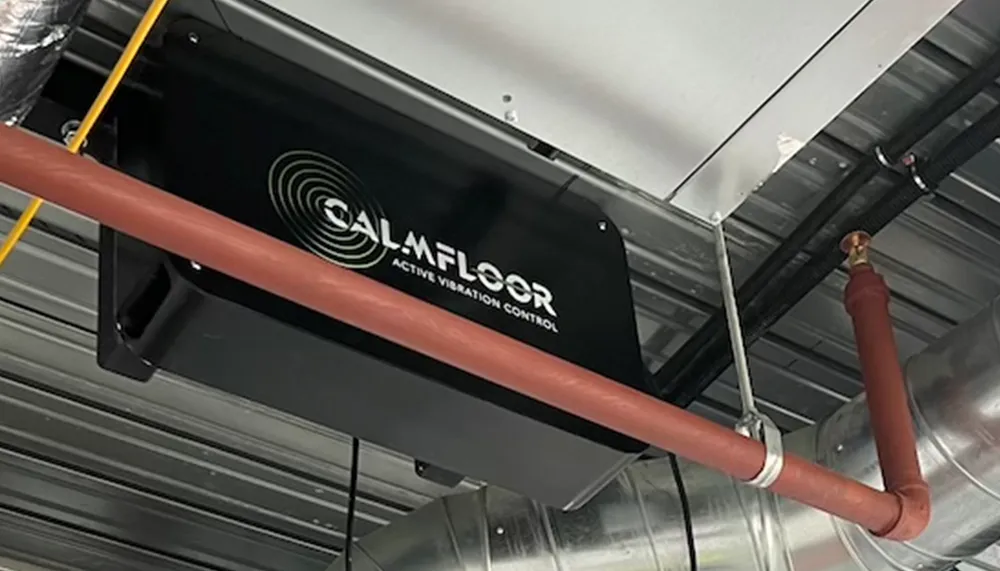
The CALMFLOOR units were attached to the web of the steel I-beams and a typical installation of this kind is shown in Image 3, top.
After the physical installation, all CALMFLOOR AMDs were commissioned with optimum control parameters for their installed locators. This was based on the point accelerance frequency response function (FRF) measurement for vertical excitation and floor vibration response at the location of each unit. This FRF measurement on the as-built floor is performed by the CALMFLOOR unit itself at the point of installation so no additional equipment is required.
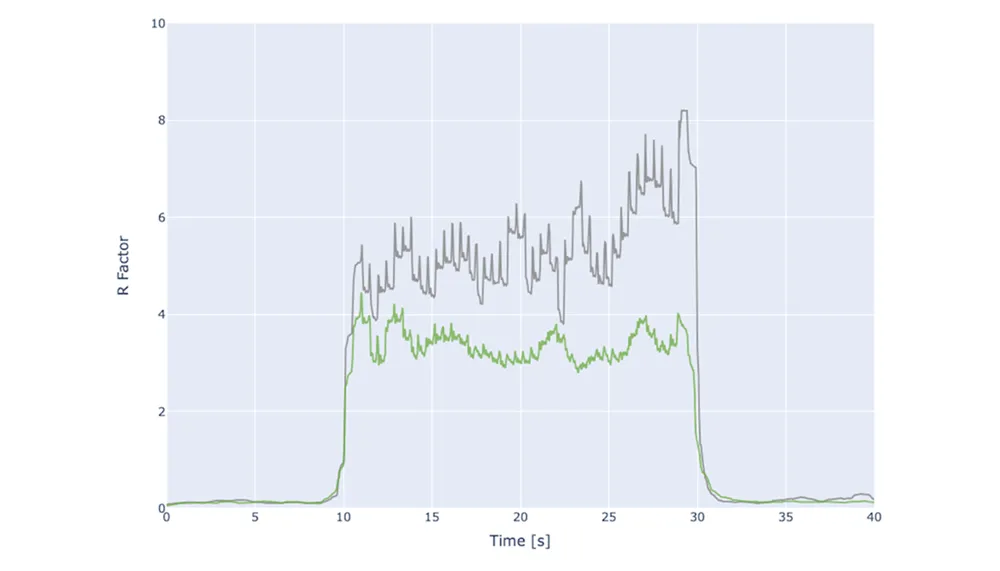
Subsequently, controlled floor vibration response tests were performed to check the controlled and uncontrolled floor vibration due to human induced activity pertinent to a typical gym floor. An example is shown in Figure 9 where a single well-trained human test subject tries to excite resonance by jumping. This was done with a help of the metronome at the location of CALMFLOOR Unit 1 in Image 6, above – one of the vibration hotspot areas shown in Image 4, above.
By comparing results in Image 5 and Image 7, above, it can be observed that the vibration simulations of the gym floor conservatively produced greater uncontrolled and vibration responses than was achieved in reality. This is normal and expected as the simulations assume resonance, which is difficult to achieve perfectly in practice for any human-induced vibrations and ignore the beneficial effects of human–structure interaction and non-structural building elements. As a result, the measured uncontrolled response factors were lower (approx. RF from 6-8 – see Image 7, above) than those predicted by the simulations (RF>16 in all vibration hotspot areas – see Image 4, above).
By comparing the maximum achieved uncontrolled and controlled RF using experimentally measured acceleration data in Image 7, above, a halving of the maximum uncontrolled RF was achieved. Similar reductions were achieved for spot checks at other vibration hotspot floor locations.
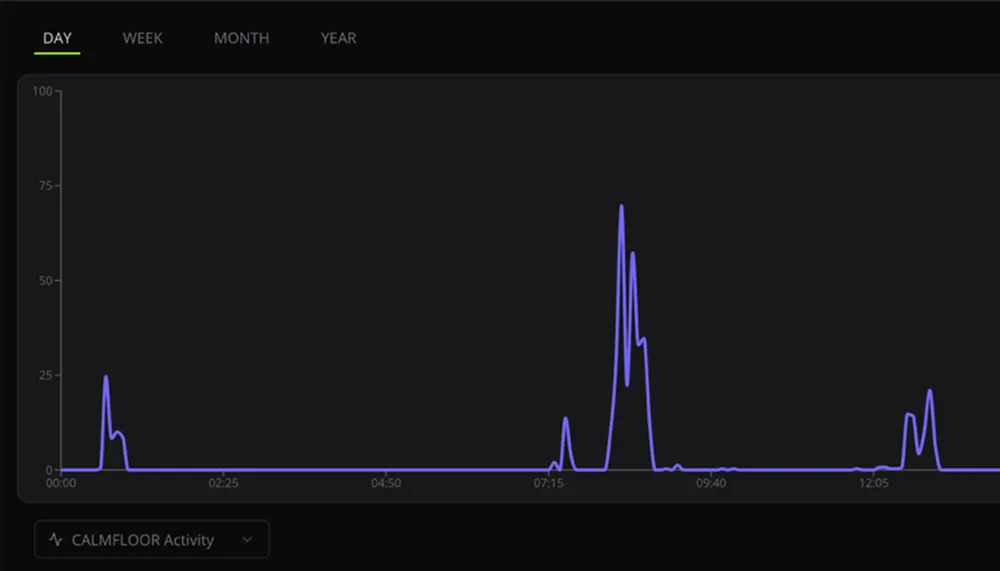
Moreover, CALMFLOOR is the only floor vibration control technology that provides continuous information about its own performance. Image 5 and 6, top, shows measured CALMFLOOR Unit No. 1 (Image 4, above) activity and floor vibration performance at the same location where the jumping test was performed during commissioning (Image 7, above).
The graph in Image 5, top, shows the percentage of time the unit’s mass is moving above a threshold value, indicating active vibration control. For example, a reading of 69.7% at 8:20 am means the mass was moving for 69.7% of the five-minute period from 8:20 to 8:25. The bottom graph shows the floor vibration score at the CALMFLOOR attachment location. A high value (up to 100%) indicates the vibration performance target is being met during the five minutes following the time shown. For instance, a reading of 99.3% at 16:15 means the target was exceeded for only 0.7% of the time (2.1 s) between 16:15 and 16:20.
The graph in Image 6, top demonstrates that the RF<4 was indeed achieved at the location of CALMFLOOR Unit No. 1 during practically 100% of the normal gym floor operation time, confirming the indicative performance from the jumping test shown in Image 7, above.
Finally, and most importantly, the gym floor and 16 CALMFLOOR units beneath it have now been in full operation for many months. During this time, no adverse comments have been received from the building’s users about perceptible floor vibrations when the gym floor area is in use.
…the gym floor and 16 CALMFLOOR units beneath it have now been in full operation for many months. During this time, no adverse comments have been received from the building’s users about perceptible floor vibrations when the gym floor area is in use.